What is AH Debugger?
- AH Debugger is a free Chrome extension. No account, login, or data upload required.
- The console overlay shows analytics events and dataLayer pushes directly on the page without opening DevTools.
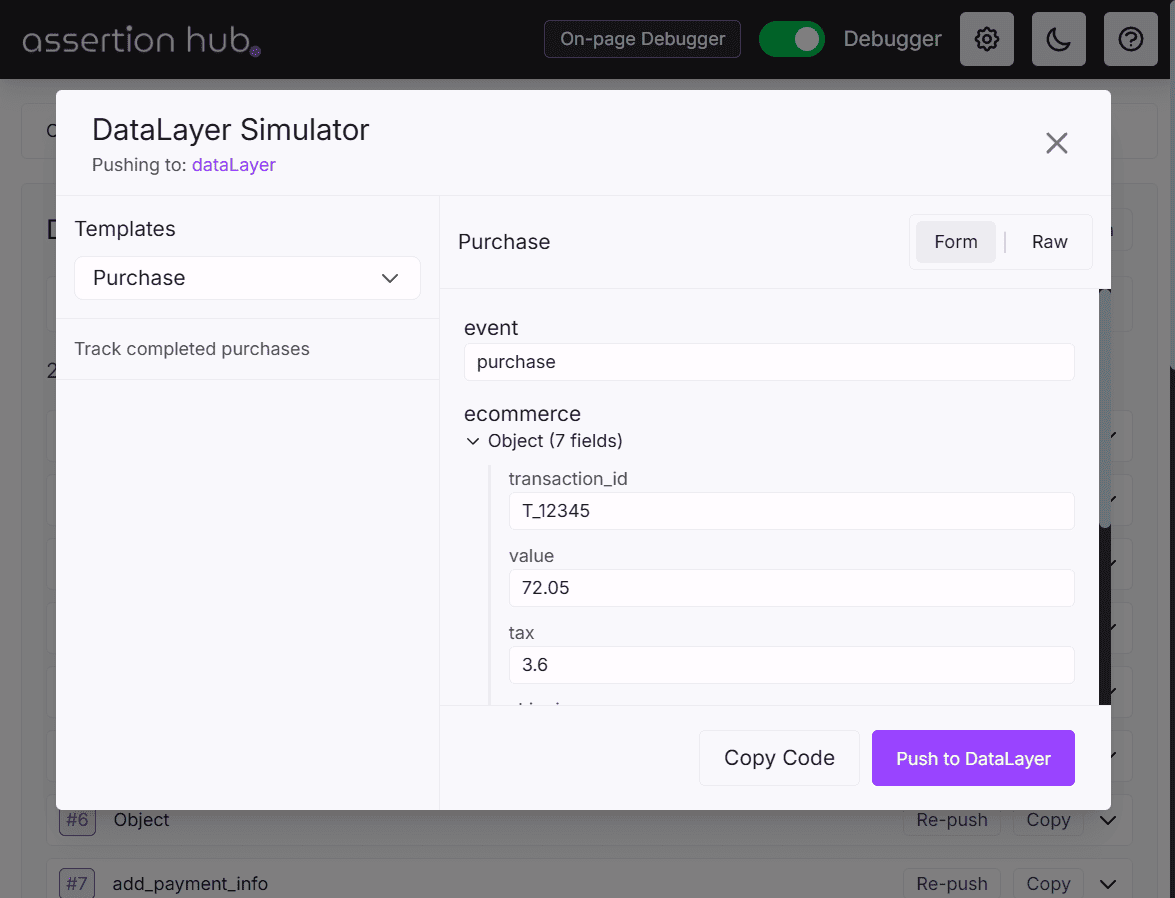
- The DataLayer Simulator lets you push synthetic GTM events without touching your site code, useful for testing tags before deploying.
- Built-in checks automatically flag silent tracking errors including missing transaction IDs, absent consent signals, and invalid Measurement IDs.
Why we built AH Debugger
Most analytics debuggers show you what requests fired. Some of the better ones also show you the dataLayer. That covers a lot, but it stops well short of what a real debugging session actually requires.
You want to test how your GTM tags respond to a specific event structure before deploying the new Data Layer push events. You want to audit Consent Mode without opening four different tabs and cross-referencing GTM’s preview mode. You want to inspect your analytics cookies without navigating to the DevTools Application panel. You want to take notes on findings and share them with a colleague without copy-pasting into a separate doc. You want the debugger to tell you automatically when a purchase event is missing transaction_id, without writing a single test yourself.
AH Debugger was built to cover all of it, and more. And it’s free, with no account required use it.
Activating the debugger
Once the extension is installed, click the AH Debugger icon in your Chrome toolbar or in the overlay floating at the bottom of your screen to open the popup. From there, toggle the debugger on for the current tab. That single toggle is what activates everything:
- Console logs start appearing immediately in your browser console (
F12→ Console): styled dataLayer push logs and analytics request logs in real time. You can deactivate the console logs in the extension settings reachable clicking on the extension icon and the setting icon top-right - The Overlay can be enabled directly from the popup, or from within the overlay itself once it’s open. It is a floating panel that sits on top of the page so you can monitor hits without keeping DevTools open
- The DevTools panel becomes available. Open DevTools (
F12), click the double arrow icon in the top-right, and select AH Debugger from the dropdown - The extension popup tabs (DataLayer, Consent Mode, Browser Storage, Vault, Mappings) are all active and updating as you browse
You don’t need to configure anything before you start. The console logs, overlay, and DevTools panel all work from the moment the debugger is toggled on.
Console Logs
Before even opening the Overlay or DevTools, AH Debugger outputs two distinct types of styled console logs directly into your browser’s developer console. Open the console (F12 → Console tab or right-click → Inspect → Console tab ) on any page where the debugger is active and you’ll see them appear in real time as you browse.
These are two separate log types, each with its own purpose.
DataLayer Push Logs
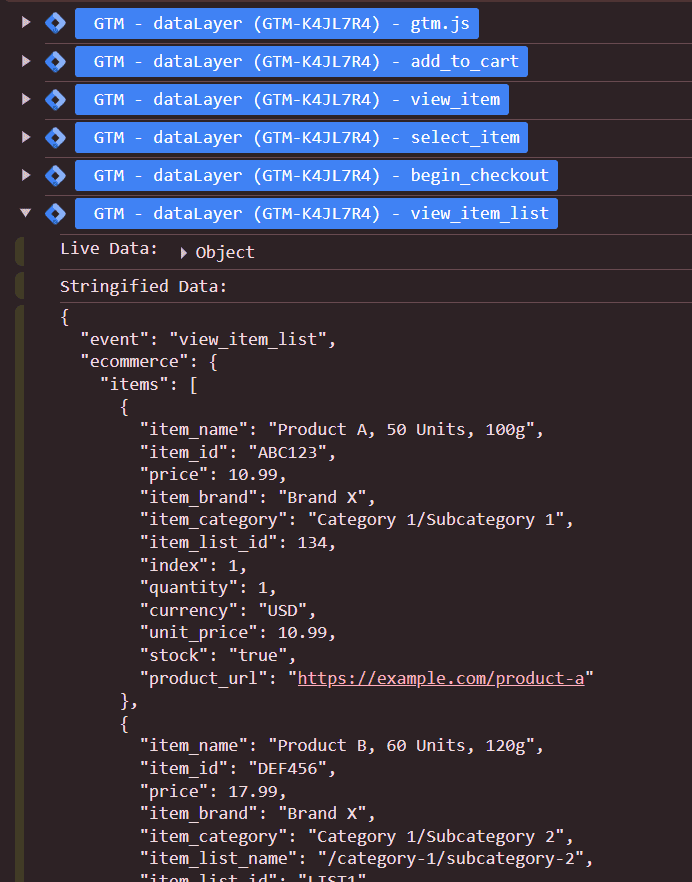
Every time something calls dataLayer.push(), AH Debugger intercepts it at the source, before GTM processes it, and logs a collapsible group to the console. Each group shows:
- A GTM logo badge in blue with the dataLayer name and container ID, so you immediately know which container the push belongs to when multiple GTM containers are present on the page
- The event name (or “Custom Object” if the push has no
eventkey) - Live Data: the raw JavaScript object as it exists in memory, fully interactive and expandable in the console
- Stringified Data: a clean JSON snapshot of the same push
These logs also work on single-page applications. Navigating between pages without a full reload will not cause any pushes to be missed.
Read more: GTM DataLayer Push Logs →
Analytics Request Logs
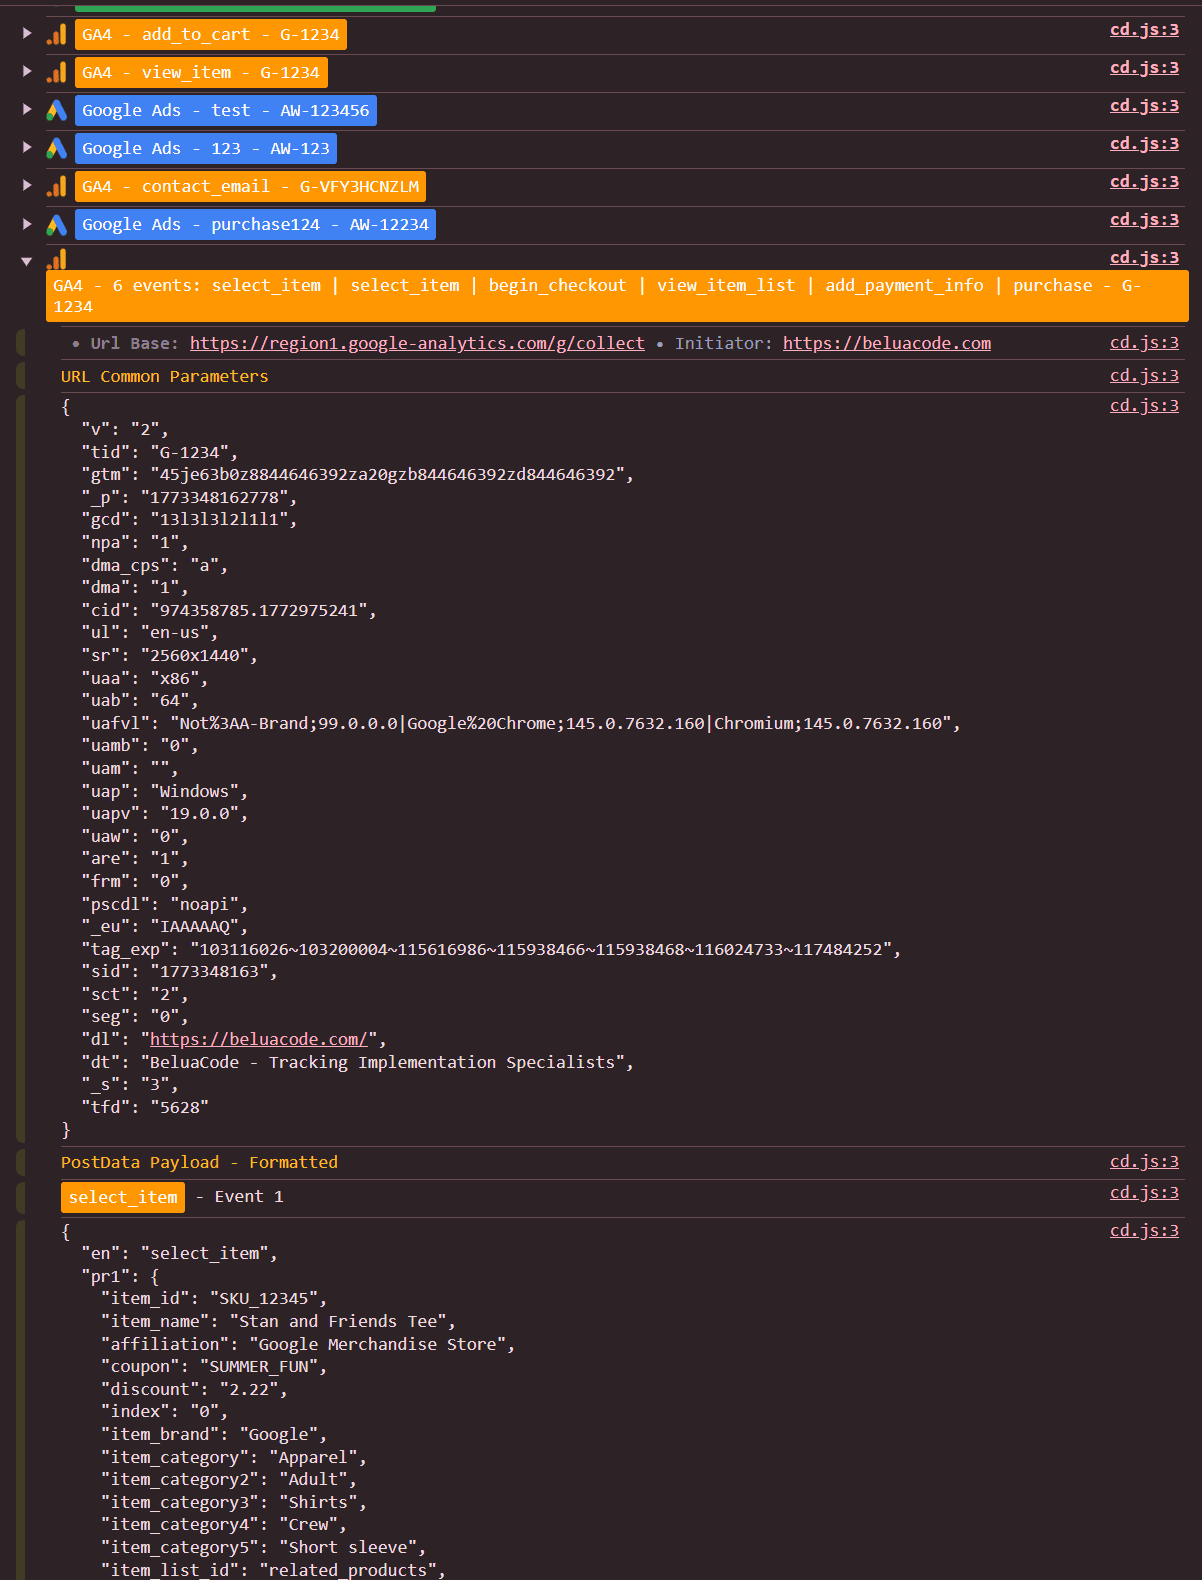
When an analytics network request fires from GA4, Facebook, Adobe, Bing, TikTok, or any other supported platform, AH Debugger logs a second type of styled console log. Each entry shows:
- A vendor logo badge color-coded by platform, so you can visually distinguish a GA4 hit from a Facebook Pixel event at a glance
- The event name and account ID extracted from the request
- URL base and initiator: where the request is going and what triggered it
- URL Parameters: the formatted query string payload
- PostData: the POST body if present, with GA4 batched events broken into individual hits so you can inspect each one separately
Errors stand out clearly: requests returning HTTP 4xx or 5xx get a red badge with the status code.
Both log types can be toggled independently in the extension settings, so you can enable only what you need without cluttering your console.
Read more: Analytics Request Logs →
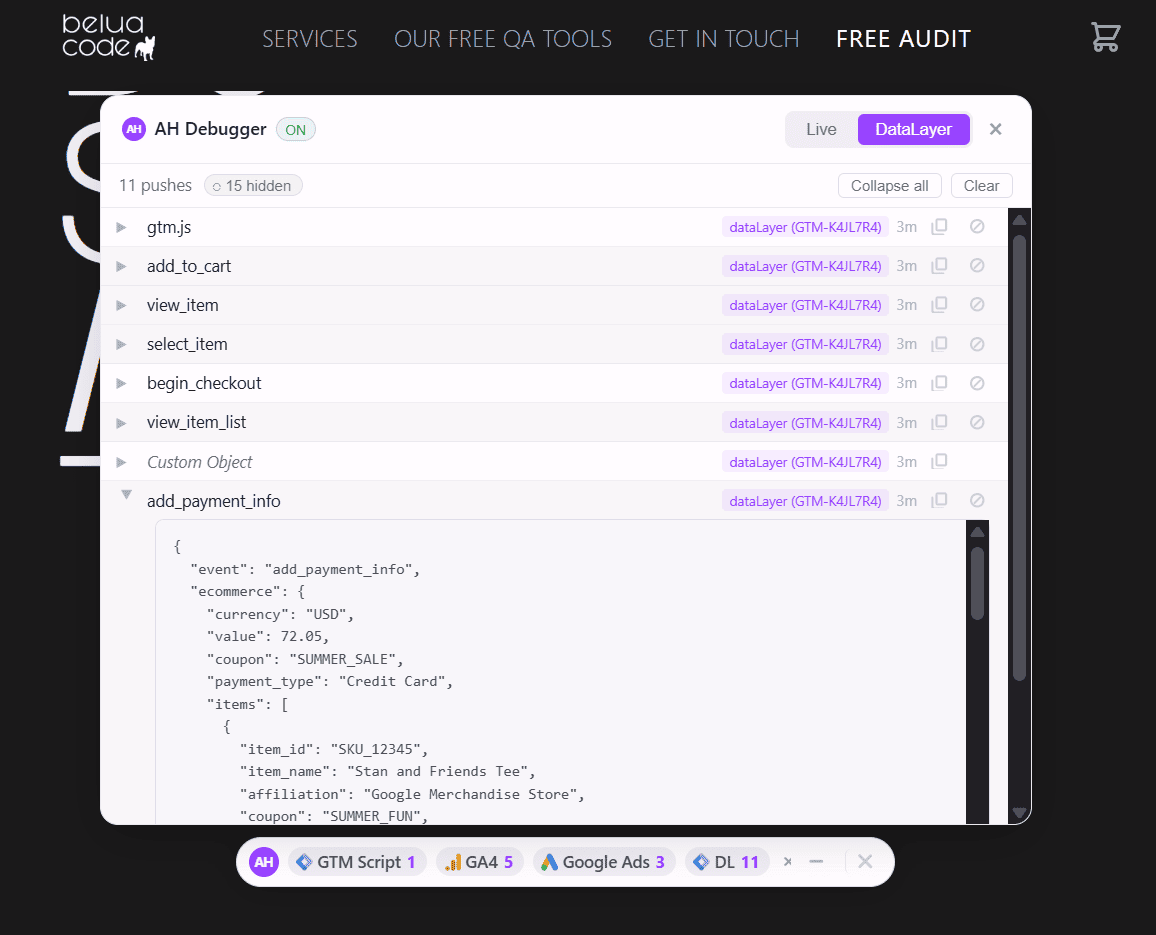
Console Overlay
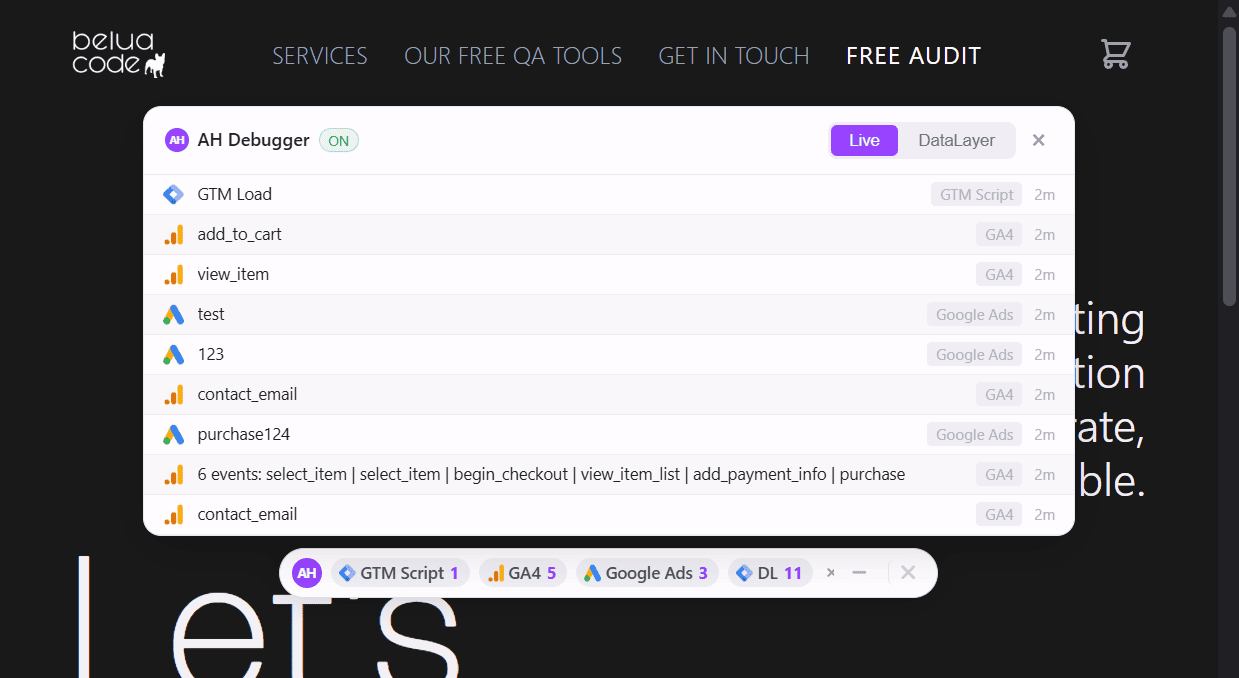
The Overlay is a floating panel that sits on top of any web page and gives you a live feed of what’s being tracked, without opening DevTools. Toggle it on from the extension popup and it stays visible as you navigate.
- Live requests feed:Every analytics hit appears instantly, labeled by vendor with color-coded icons. Errors appear highlighted in red so nothing slips by. The feed shows the last 50 events with time-ago timestamps and auto-scrolls as new events come in.
- DataLayer feed:Switch tabs inside the overlay to see every dataLayer push in real time, with the GTM container ID, the dataLayer name, and an expandable JSON preview with syntax highlighting. You can copy any push to clipboard in one click.
- DL Push Event filtering:Hide specific event names you don’t care about (like
gtm.scrollorgtm.dom) so the feed only shows what matters. Manage excluded events from the overlay’s built-in exclusion panel.
You can drag the overlay anywhere on the page, minimize it to a compact pill, or hide it entirely and reopen it from the popup without losing your session.
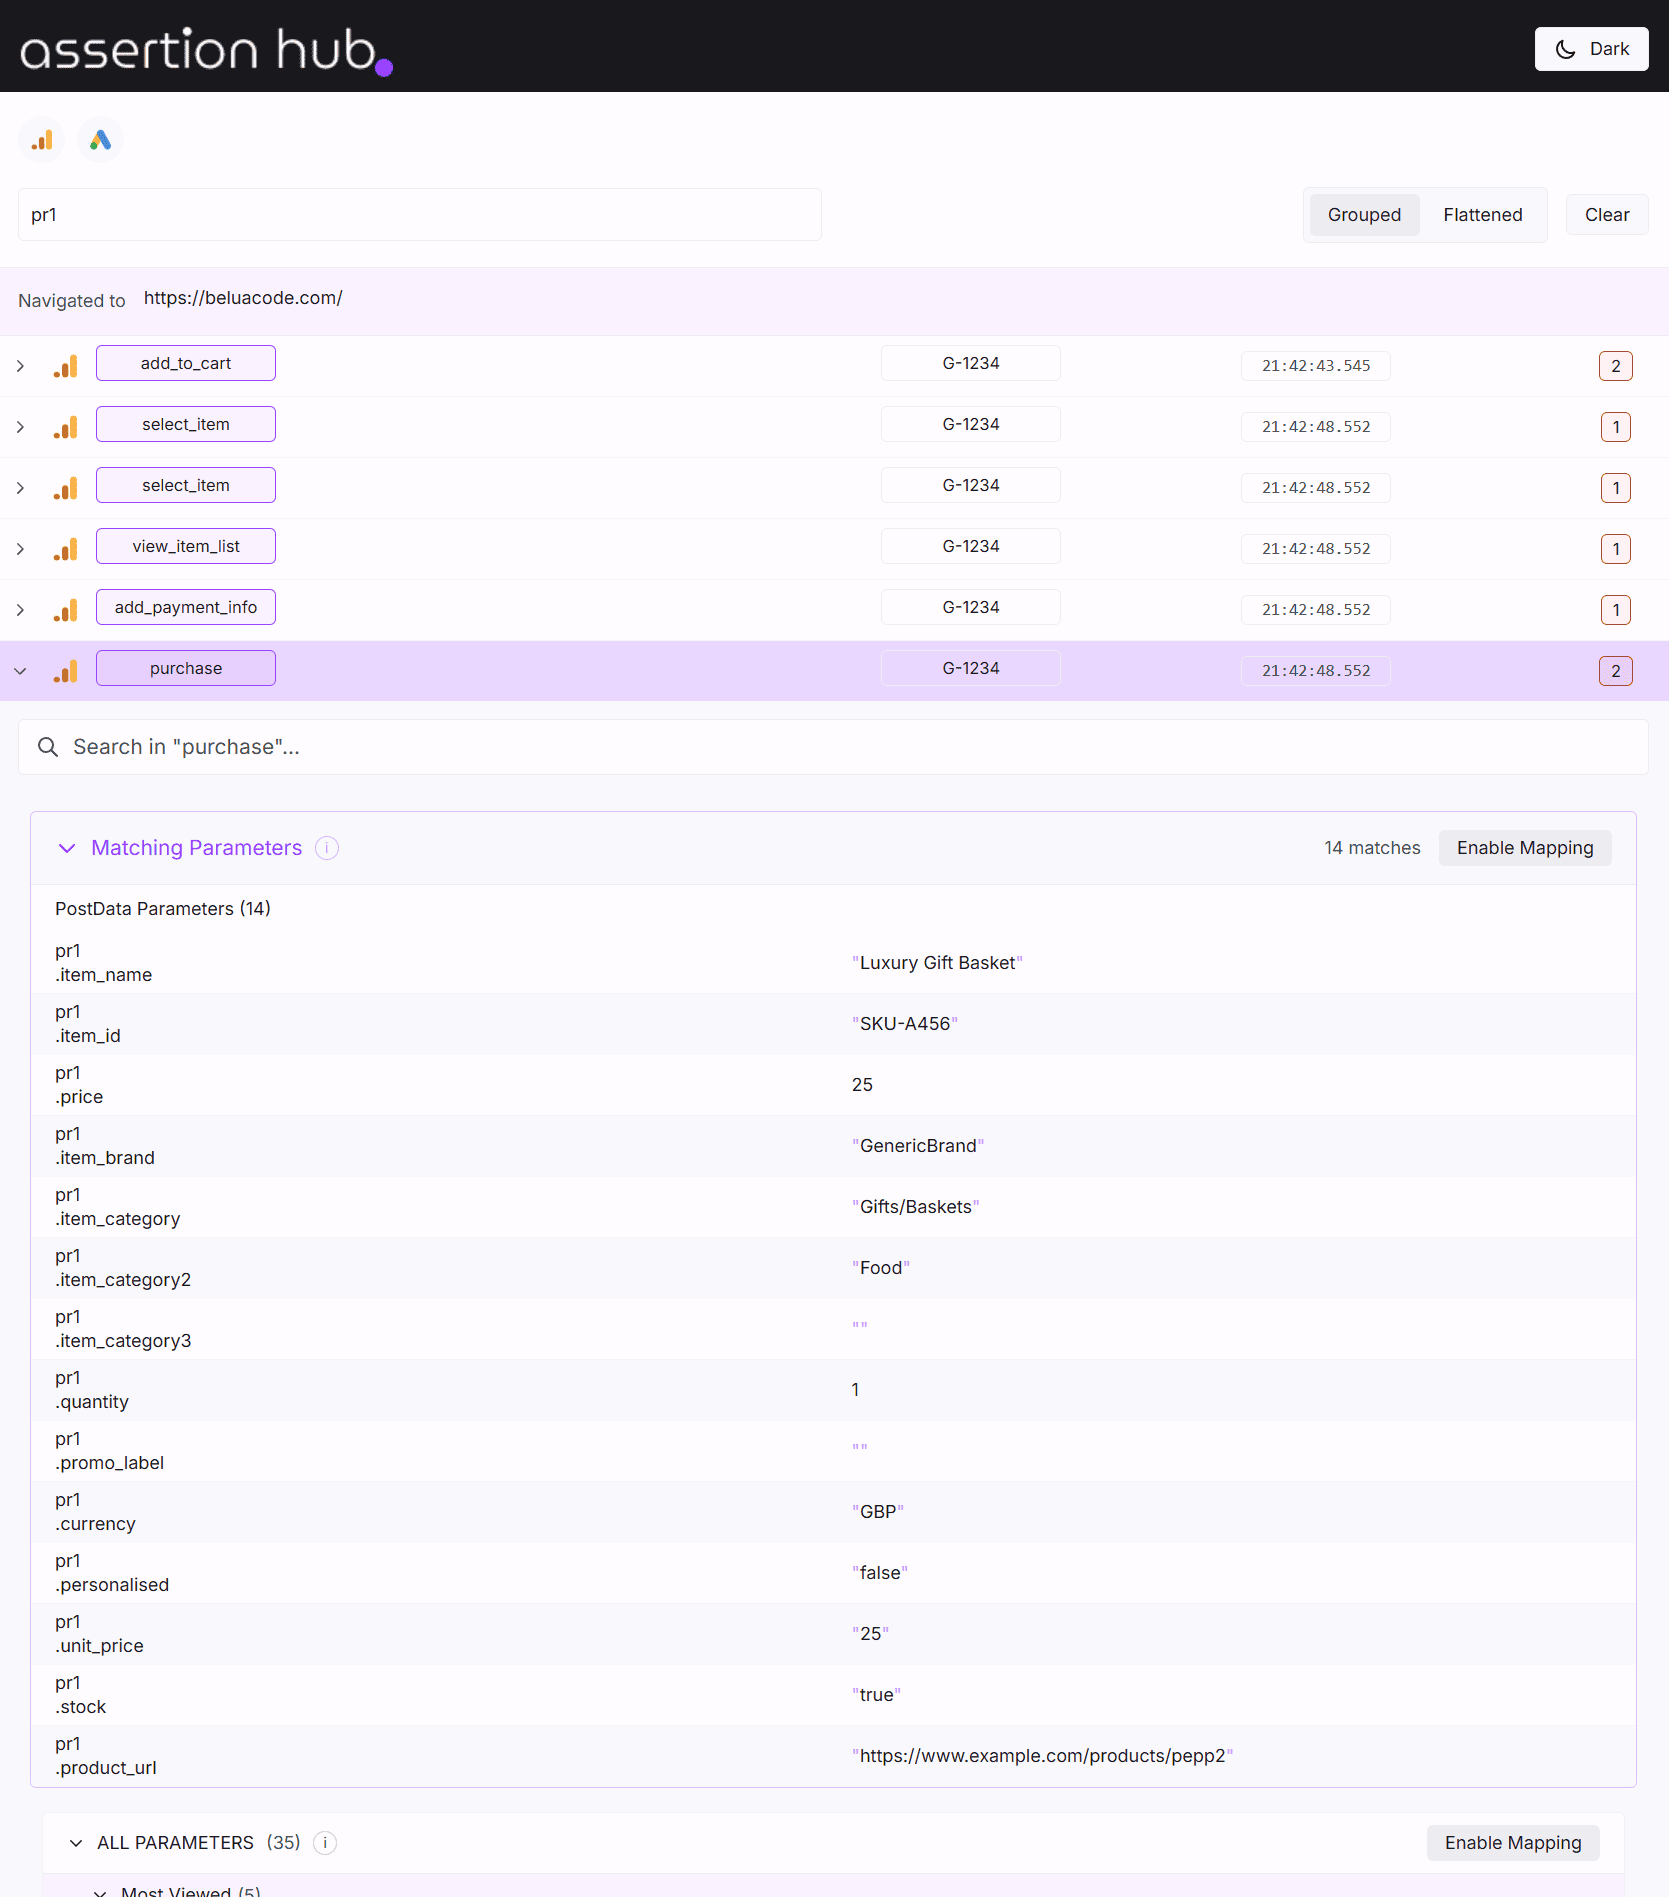
DevTools Panel
Open the DevTools panel by right-clicking any page, selecting Inspect, clicking the double arrow icon (top right of DevTools), and choosing AH Debugger from the dropdown. This is where deep debugging happens.
- Full request table:Every intercepted analytics request is listed with vendor, event name, timestamp, status, and error indicators. Paginated at 100 requests per page to keep things fast.
- Grouped and flattened views:Toggle between a grouped view (requests organized by event name) and a flat chronological list, depending on what you’re investigating.
- Global search:Filter every request, across all vendors and all collected data, by any parameter name or value. Looking for where
transaction_idis missing? Search for it. Need to find every request whereitemsare present? One search. - Per-vendor filtering:Show only GA4, only Facebook, only Adobe, or any combination. Useful when a page fires dozens of requests across multiple platforms and you need to focus.
- Full request inspection:Expand any request to see its complete URL, all query parameters, POST body, and any error details. Batch requests are broken apart so you can inspect each hit individually.
- Built-in Checks:The panel runs automated validation on your collected session data and surfaces issues directly in the interface. See the Built-in Checks section below for details.
Read more: Analytics Request Logs →
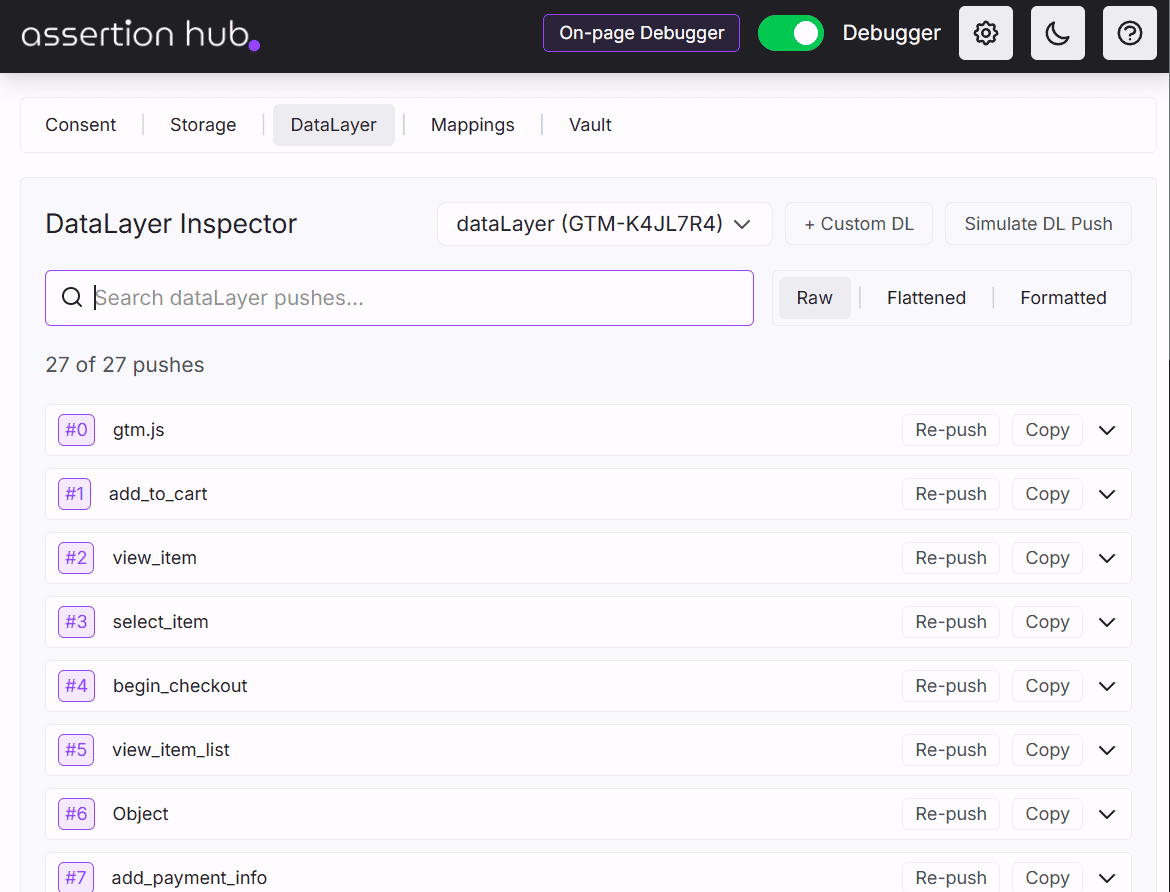
DataLayer Viewer and Simulator
Access the DataLayer tab from the extension popup. This panel connects directly to your GTM containers on the page.
- Automatic container detection:AH Debugger finds all GTM containers on the page and maps them to their associated dataLayers. If you use multiple containers or a non-standard dataLayer name, it handles that too.
- Real-time push capture:Every dataLayer.push() is intercepted and logged with a timestamp and push count, so you can see the exact sequence of events as they happen.
- Three view modes:Switch between Raw (original structure), Flattened (key-value pairs, easier to scan), and Formatted (enhanced display) to match how you prefer to read the data.
- DataLayer Simulator:Push synthetic events directly to the dataLayer without touching your codebase. This lets you test how your tags respond to specific event structures before deploying any code. Essential for QA workflows.
- Search across pushes:Filter pushes by any key or value.
Read more: DataLayer Viewer and Simulator →
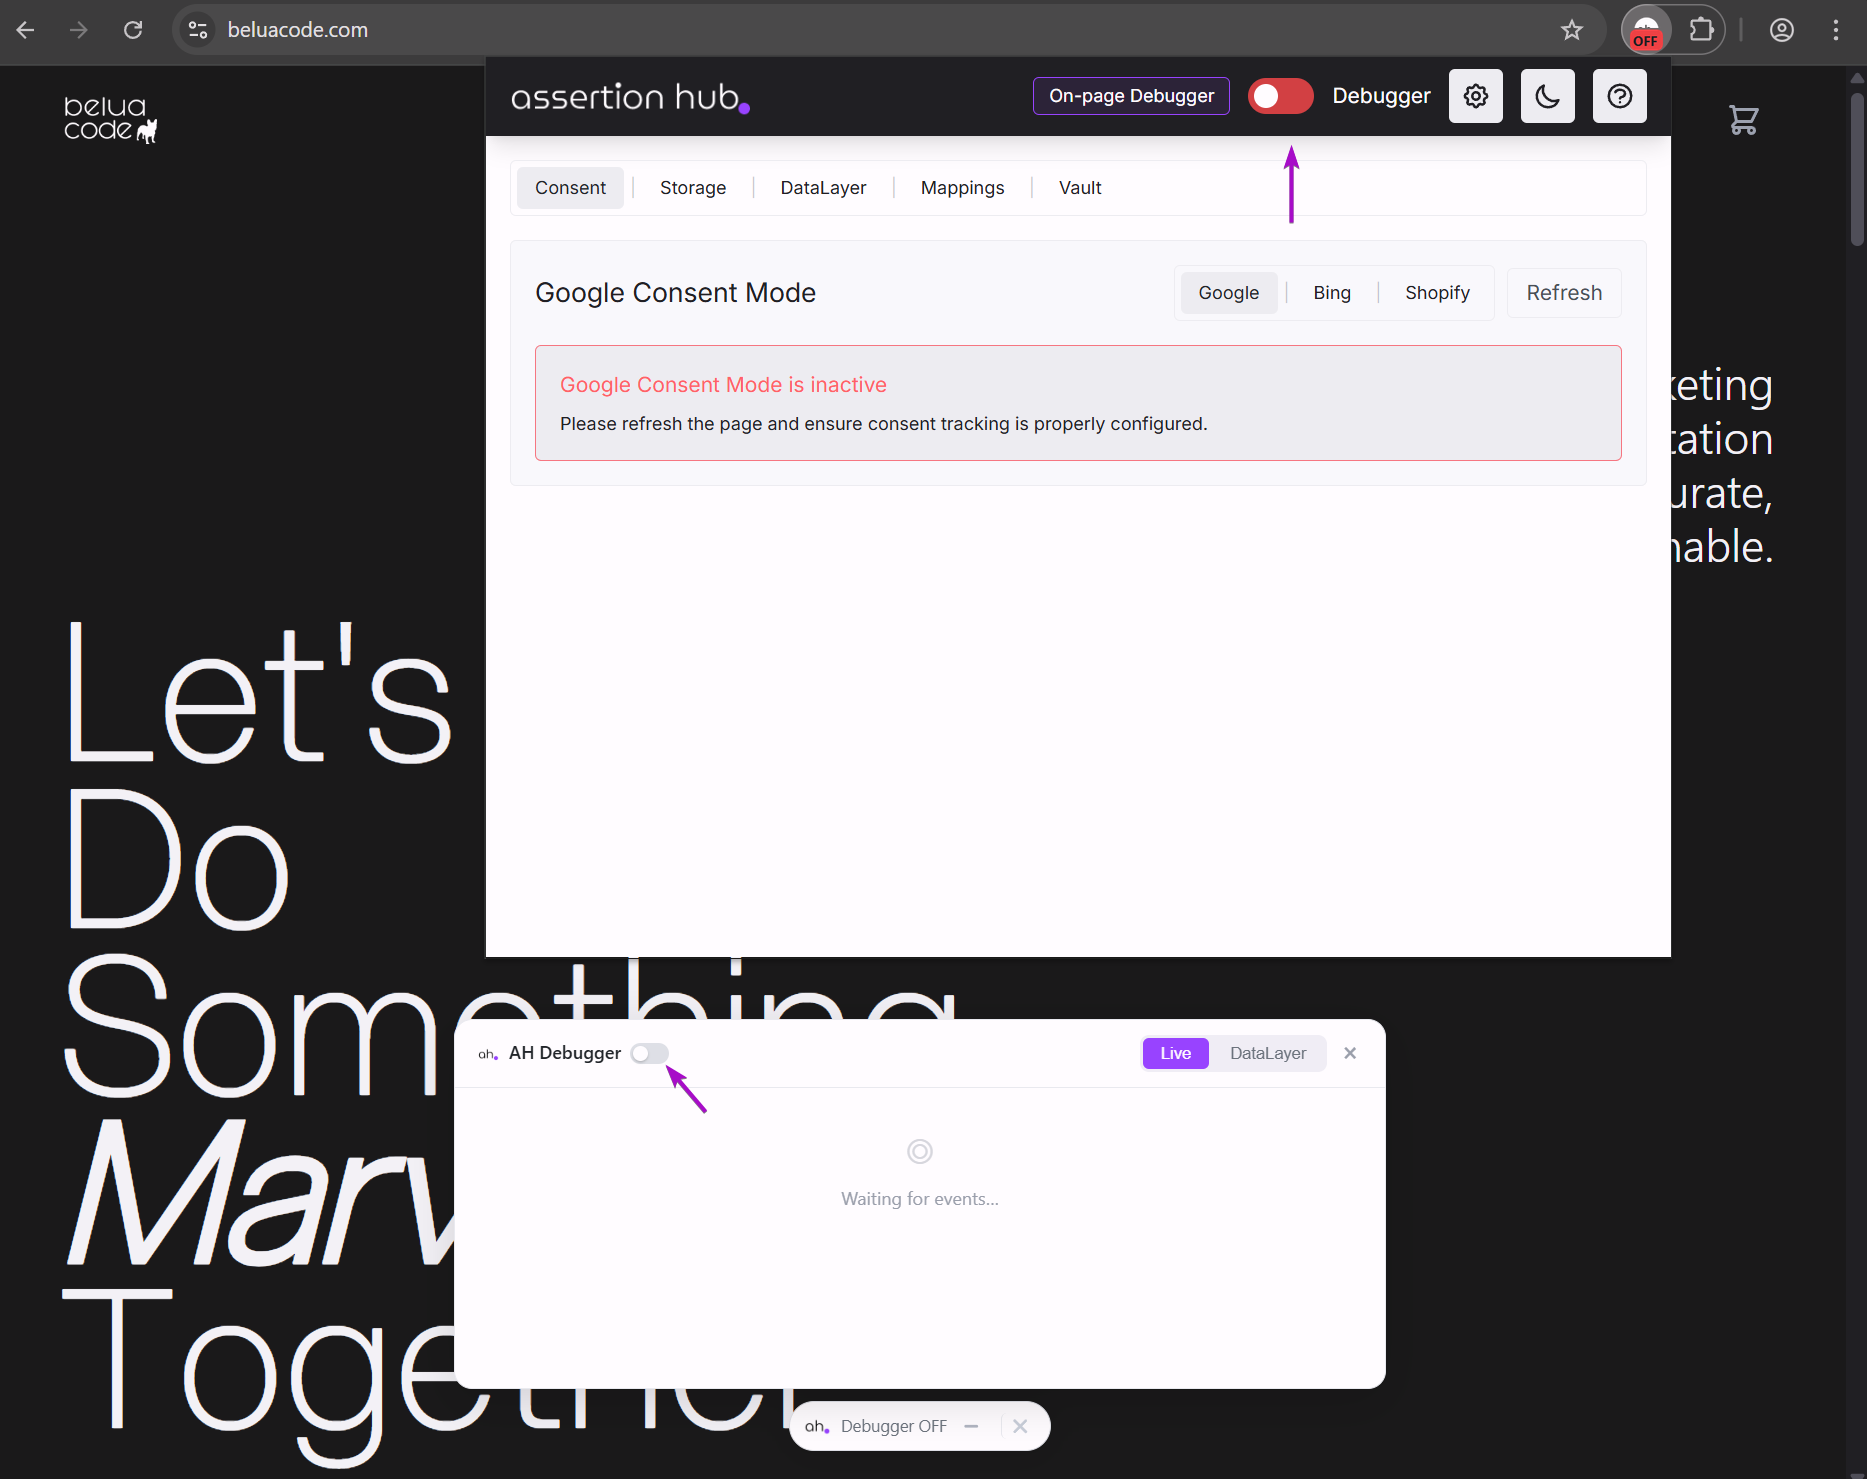
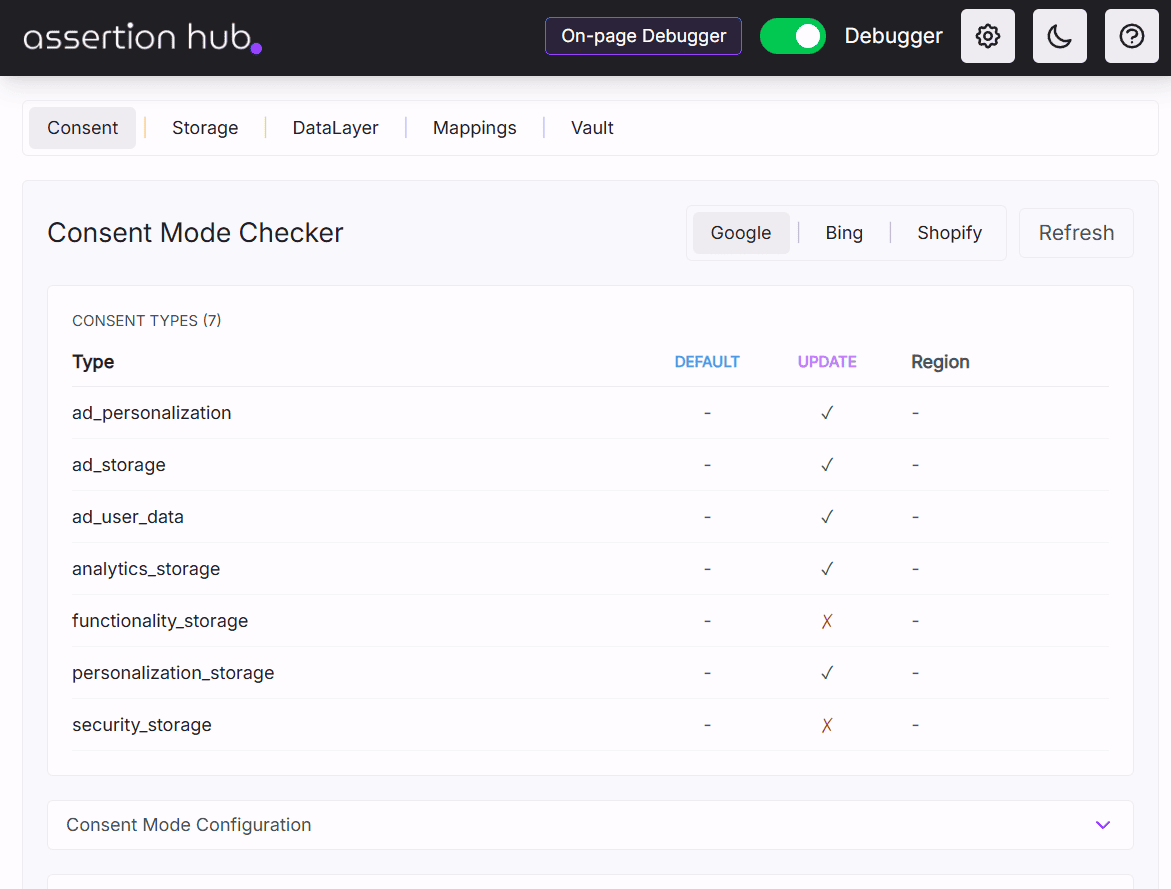
Consent Mode Checker
For any implementation using Consent Mode, the Consent Mode tab in the popup gives you a dedicated audit view.
- Google Consent Mode:See the current state of all detected consent types:
analytics_storage,ad_storage,ad_user_data,ad_personalization,functionality_storage,personalization_storage,security_storage. View the full consent command history, all the DataLayer push that influenced the Consent Mode, and GTM container configuration. - Cross-domain tracking:Verify cross-domain measurement is set up correctly.
- Bing UET consent:Monitor Bing’s consent state independently.
- Shopify consent:Purpose-built detection for Shopify’s consent framework used in e-commerce storefronts.
All consent data refreshes on demand, so you can re-check after user interactions like accepting a consent banner.
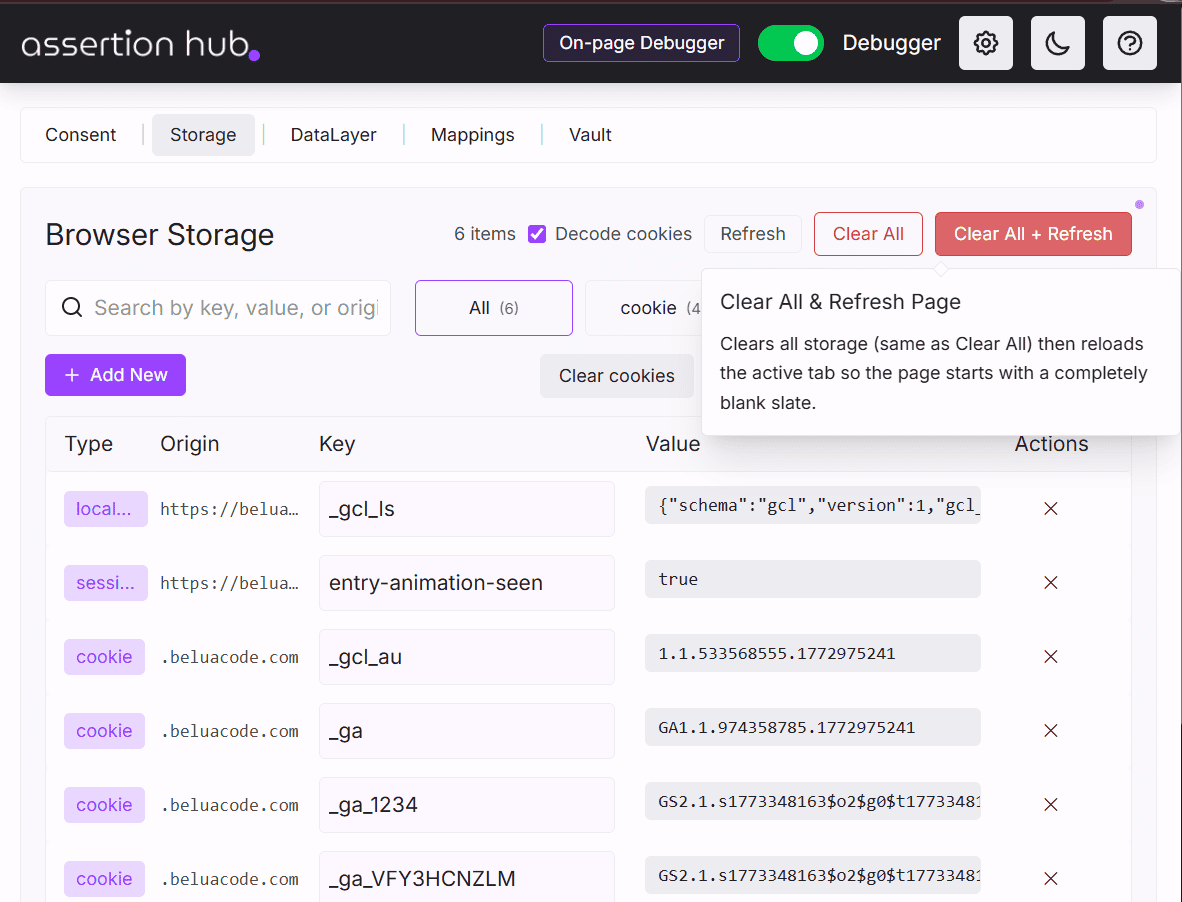
Browser Storage Manager
The Browser Storage tab gives you a full read-write interface for everything stored in the browser, without needing to navigate the DevTools Application panel.
- Storage types:Inspect and manage Cookies, LocalStorage, and SessionStorage all in one place.
- Add, edit, and delete:Create new items, edit values inline, delete individual entries, or wipe an entire storage type in one click.
- Search and filter:Search across all stored items by key or value, and filter by storage type. Item counts are shown per type so you know what you’re dealing with before digging in.
- Base64 decoding:Toggle automatic Base64 decoding for cookie values. Many analytics platforms and consent tools encode cookie data in Base64, and this makes reading those values instant.
- Clear All: Permanently deletes all cookies, localStorage, and sessionStorage for every origin on the page, including iframes. Cannot be undone.
- Clear All + Refresh: Clears all storage and immediately reloads the page. Without this, testing a clean state (like resurfacing a cookie consent banner) requires manually deleting everything from the browser and then reloading. This does both in one click.
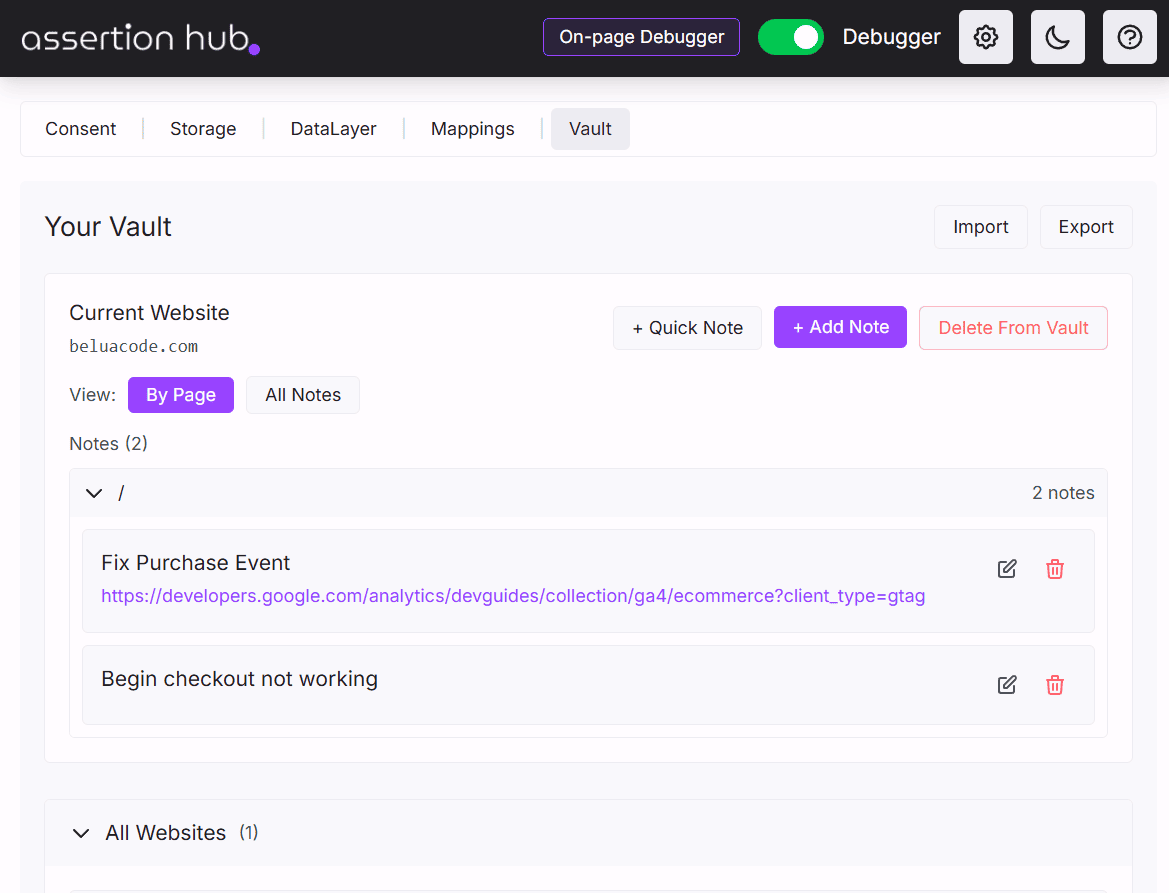
Vault
The Vault is a persistent notes system built into the extension for storing findings as you debug.
- Site-organized notes:Notes are grouped by website hostname. Add a website once and all your notes for that domain stay together.
- Per-page notes:Within each site, notes can be tied to a specific page URL so you always know where a finding came from.
- Tags and full notes:Add quick one-line notes or structured notes with a title, body, URL reference, and tags for easy retrieval later.
- Two browsing views:Browse by Page (hierarchical view per site) or All Notes (flat list with page references).
- Import and export:Export your entire vault as a JSON backup and import it on another machine or share it with a colleague. Useful for handing off a debugging session or onboarding a team member to an existing implementation audit.
- Full control:Create, edit, and delete notes and sites at any time.
No data ever leaves your browser. The Vault lives entirely in your extension/browser storage. This means, that if you use a shared browser, you can collaboratively contribute to the Vault.
Read more: Vault →
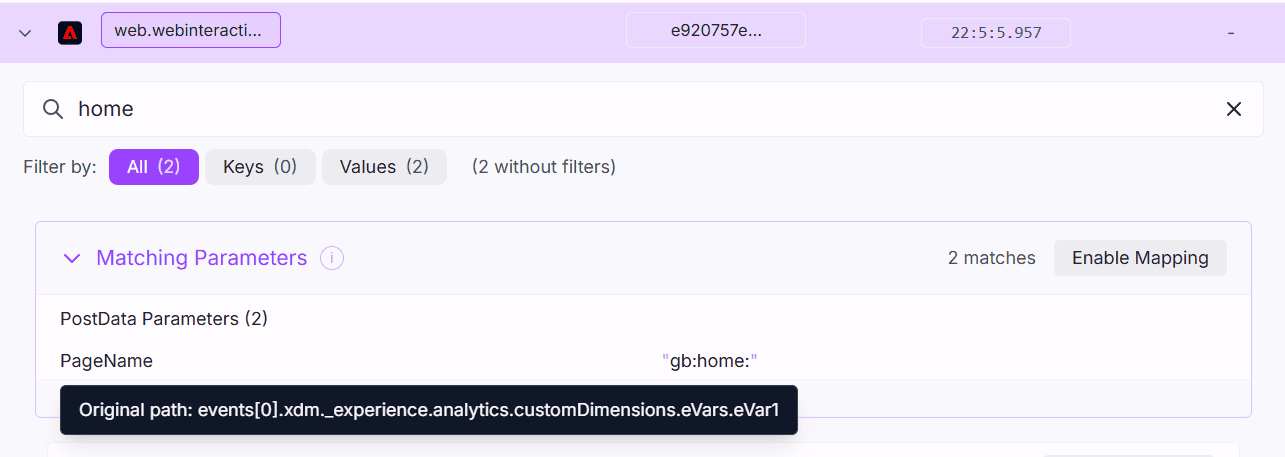
Custom Mappings
Analytics platforms use parameter names that don’t always match what your team calls things internally. The Mappings tab lets you define custom aliases.
- Multi-vendor support:Create mapping sets for Adobe Web SDK, Adobe Launch, GA4, Google Ads, Facebook, Bing Ads and more.
- Site-specific configurations:Different mappings for different websites, so your production setup and your staging setup can have different display rules.
- Import and export:Share mapping configurations across your team as JSON files.
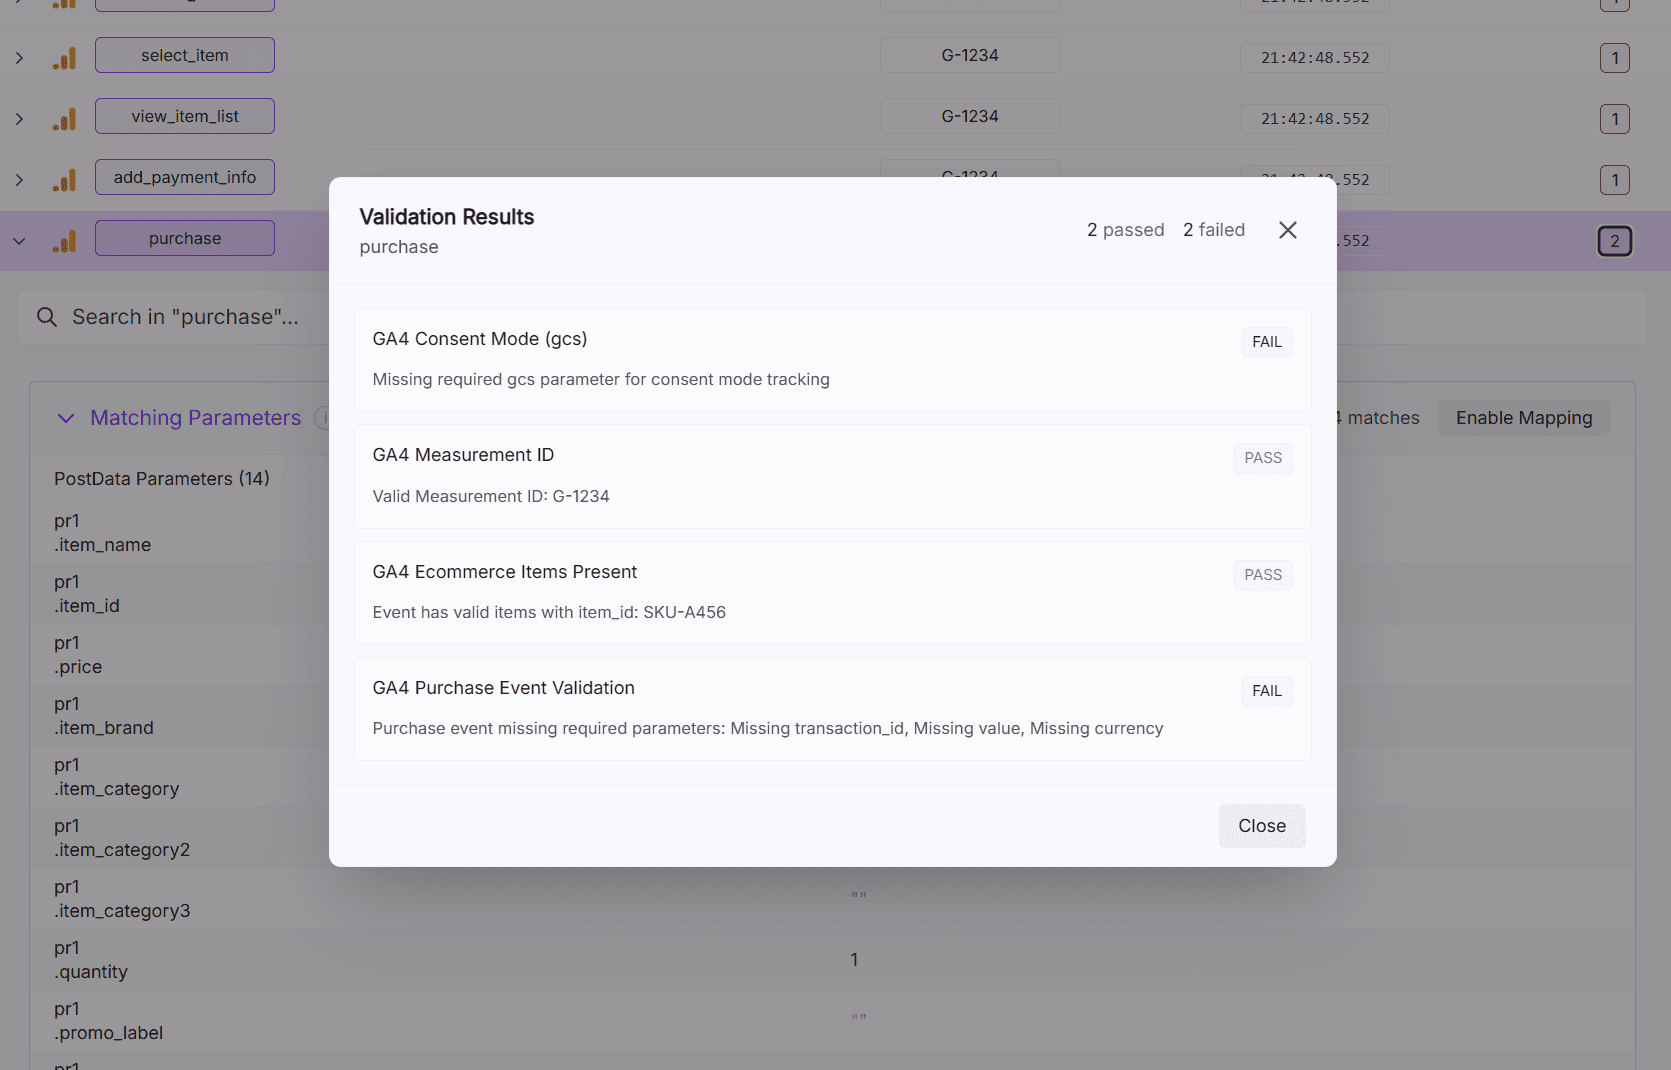
Built-in Checks
AH Debugger automatically validates the requests collected during your browsing session and reports any issues in the DevTools panel. No setup required. They run on every session.
Current built-in checks include:
- Consent Mode signal presence:Verifies the
gcsparameter exists on GA4 hits - Measurement ID format:Validates the
tidparameter follows theG-prefix format - Ecommerce items array:Flags ecommerce events (add_to_cart, purchase, view_item, etc.) that are missing a populated
itemsarray - Purchase event completeness:Checks that purchase events include
transaction_id,value, andcurrency
Results are shown with pass/fail status and severity levels (error vs warning). We are actively expanding the built-in check library based on user feedback.
Read more: Built-in Checks →
Platform coverage
AH Debugger intercepts and parses requests from all major analytics and advertising platforms:
| Platform | What’s captured |
|---|---|
| Google Analytics 4 | All hits, event parameters, ecommerce data, consent signals |
| Google Tag Manager | DataLayer pushes, container configuration, consent commands |
| Google Ads | Conversion and remarketing tags |
| Facebook / Meta | Pixel events and custom data |
| Bing / Microsoft UET | UET events and consent state |
| Adobe Web SDK | XDM events |
| Pinterest Tag | Events and custom data |
Ready to get started? Read How to install and use AH Debugger →
Frequently Asked Questions
Is AH Debugger free?
Does AH Debugger collect or store my data?
Which analytics and advertising platforms does AH Debugger support?
Does AH Debugger work on Single Page Applications (SPAs)?
pushState, hashchange, and load events, so no dataLayer pushes are missed during client-side navigation in SPAs.What is the DataLayer Simulator and when should I use it?
Co-founder of BeluaCode and AssertionHub
Analytics Developer specialised in tracking implementation,
implementations QA, tag management and highly customised solutions
when standard tools don't fit.
Runs
BeluaCode
as an implementation agency helping other experts when things get
too complex and
AssertionHub
to automate tracking validation on Analytics events.