Debug dataLayer Push Events in Chrome: Free GTM DataLayer Debugger Extension
- AH Debugger intercepts every dataLayer.push() before it reaches GTM. No GTM Preview mode required.
- Console overlay and DevTools panel both display pushes in real time, decoded and formatted for readability.
- Works on SPAs. Pushes fired by React, Vue, or Angular apps are captured without a page reload.
- Use the DataLayer Viewer to compare the push structure against your expected schema side by side.
What is a dataLayer push
A dataLayer push is a call to dataLayer.push() that sends data to Google Tag Manager. It typically carries an event name and associated data such as ecommerce details, user properties, or custom parameters that GTM uses to trigger tags and populate variables.
When a GTM implementation breaks, the standard approach is opening GTM Preview mode, scattering console.log statements across the codebase, or trying to spot the push in a noisy browser console full of other logs. None of these give you a clean, reliable view of the raw data as it flows.
AH Debugger is a free Chrome extension that changes that. Install it from the Chrome Web Store, toggle it on, and every dataLayer.push() is intercepted before GTM processes it and made immediately readable in your console, the floating Overlay, and a dedicated DataLayer Viewer. You see the raw data exactly as it was pushed, independent of any GTM variable transformations, with the container ID, event name, and full structure in the order pushes happened.
This article covers dataLayer push logs. For analytics network request logs, read Analytics Request Logs →
Console Logs
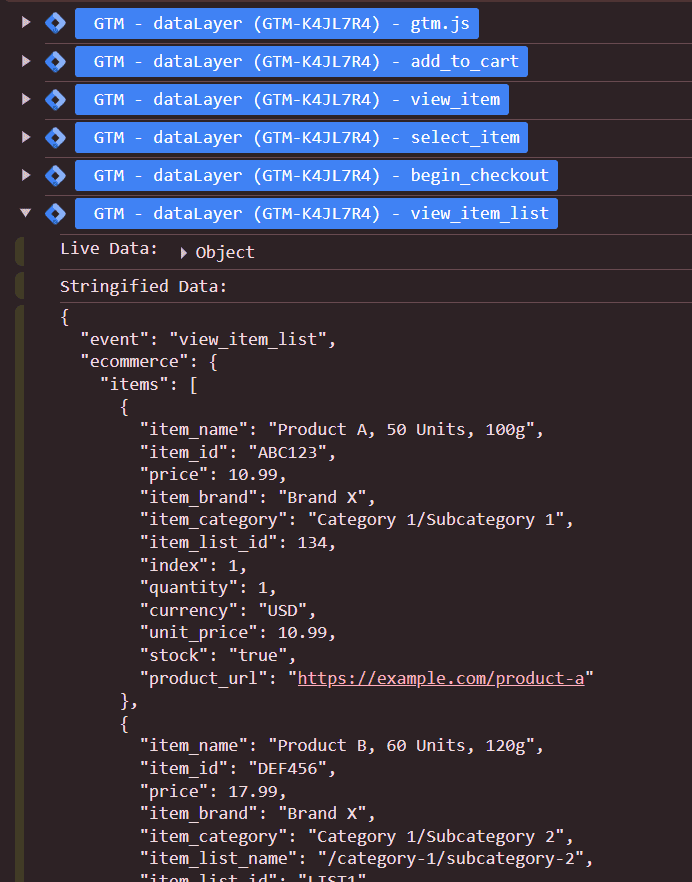
With AH Debugger active, every dataLayer.push() produces a collapsible log group in your browser console (F12 → Console). Each group shows:
- A GTM logo badge in blue with the dataLayer name and container ID. When multiple GTM containers are present on the page, this tells you immediately which container the push belongs to
- The event name, or “Custom Object” if the push has no
eventkey - Live Data: the raw JavaScript object as it exists in memory, fully interactive and expandable in the console
- Stringified Data: a clean JSON snapshot of the same push, easy to copy and share
These logs also work on Single Page Applications. AH Debugger re-initializes its dataLayer observer on navigation events, so pushes are never missed during client-side page transitions.
Console Overlay
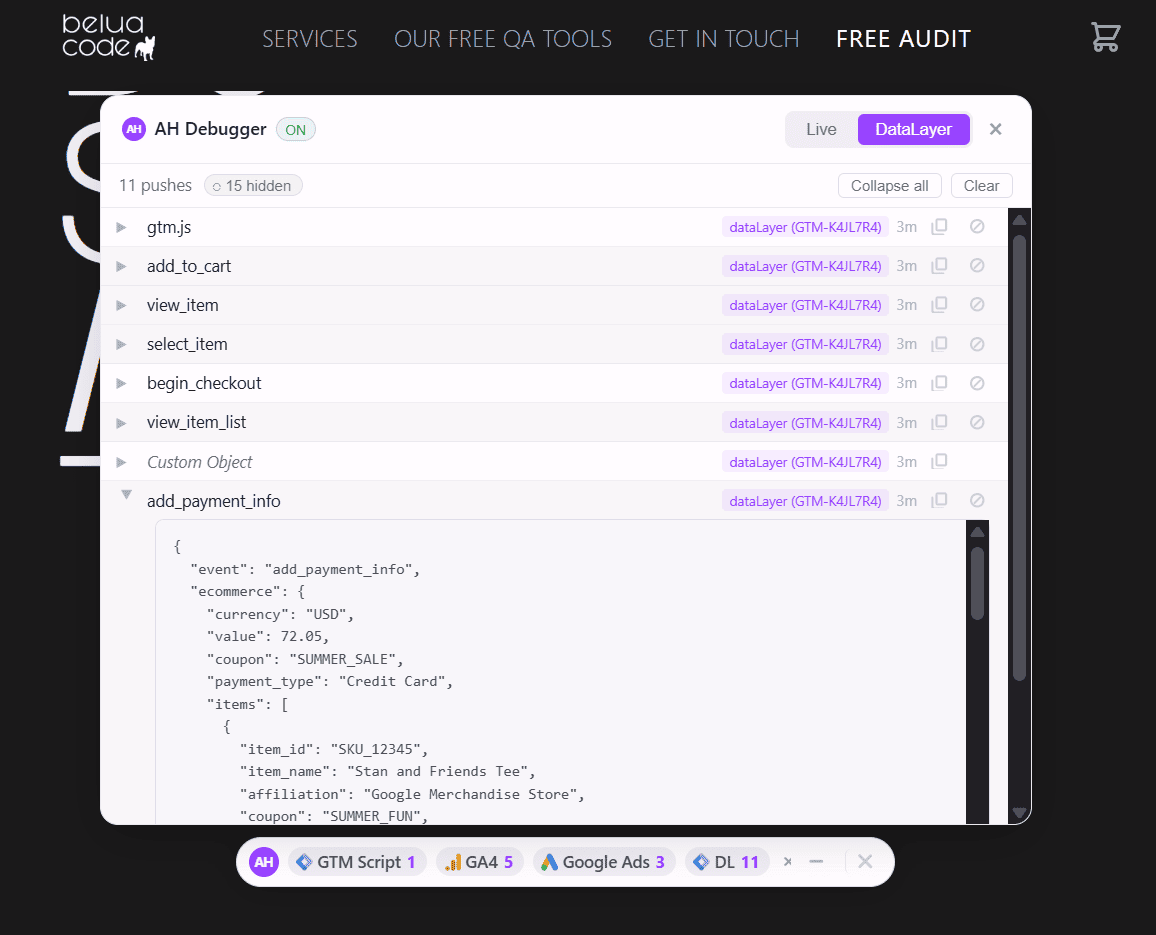
The Overlay includes a dedicated DataLayer feed tab alongside the live analytics requests feed. Switch to it to see every dataLayer push in real time without opening DevTools.
Each entry shows the GTM container ID, the dataLayer name, and an expandable JSON preview with syntax highlighting. You can copy any push to clipboard in one click.
You can also filter out pushes you do not want to see. Noisy events like gtm.scroll or gtm.dom can be hidden from the feed using the overlay’s built-in exclusion panel, leaving only the pushes relevant to your current investigation.
DataLayer Viewer
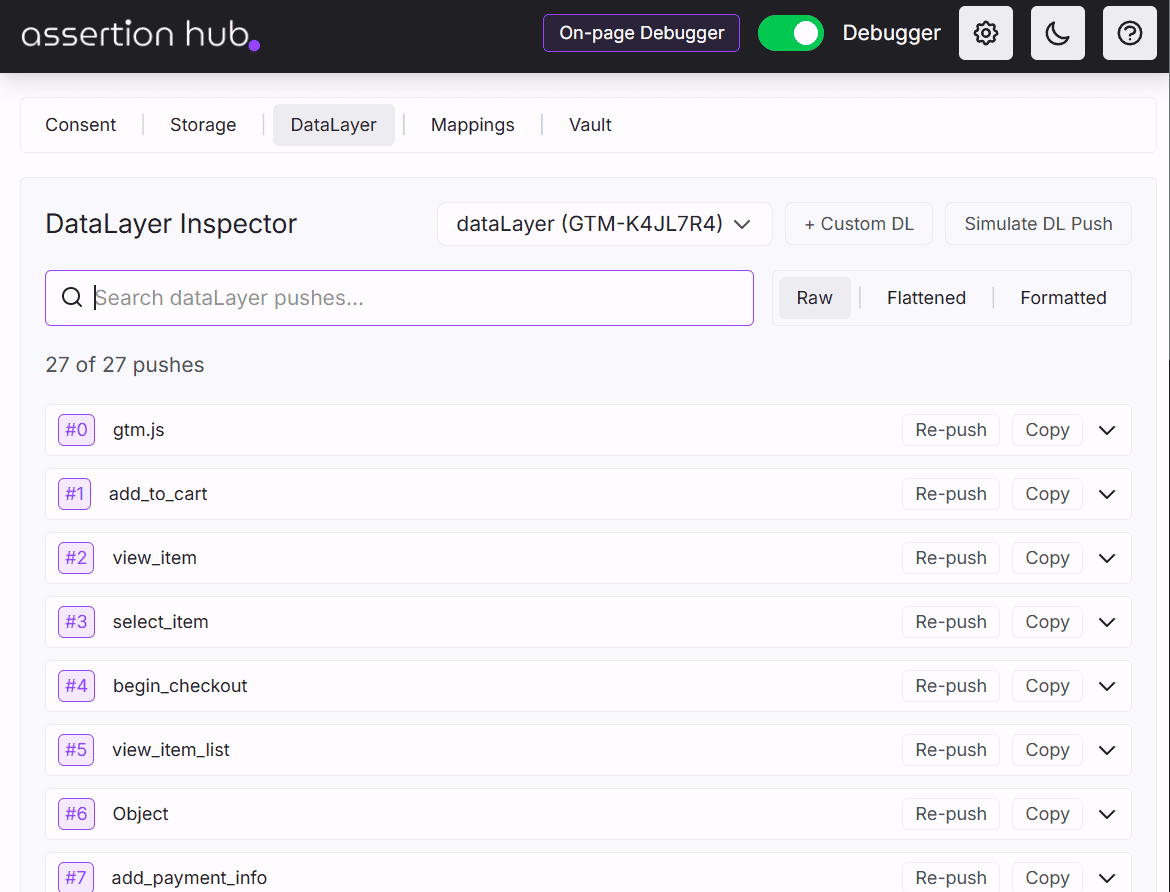
The DataLayer tab in the extension popup is the dedicated interface for reading dataLayer pushes across a full session. It connects directly to your GTM containers and captures every push with a timestamp and a sequential push count.
- Automatic container detection: AH Debugger finds all GTM containers on the page, including setups with multiple containers or non-standard dataLayer names, and maps each one automatically
- Three view modes: switch between Raw (original structure), Flattened (key-value pairs, easier to scan for a specific parameter), and Formatted (syntax-highlighted display for complex objects)
- Search: filter pushes by any key or value across the full captured session
- Copy to clipboard: copy any push as JSON in one click
Read the full guide: DataLayer Viewer and Simulator →
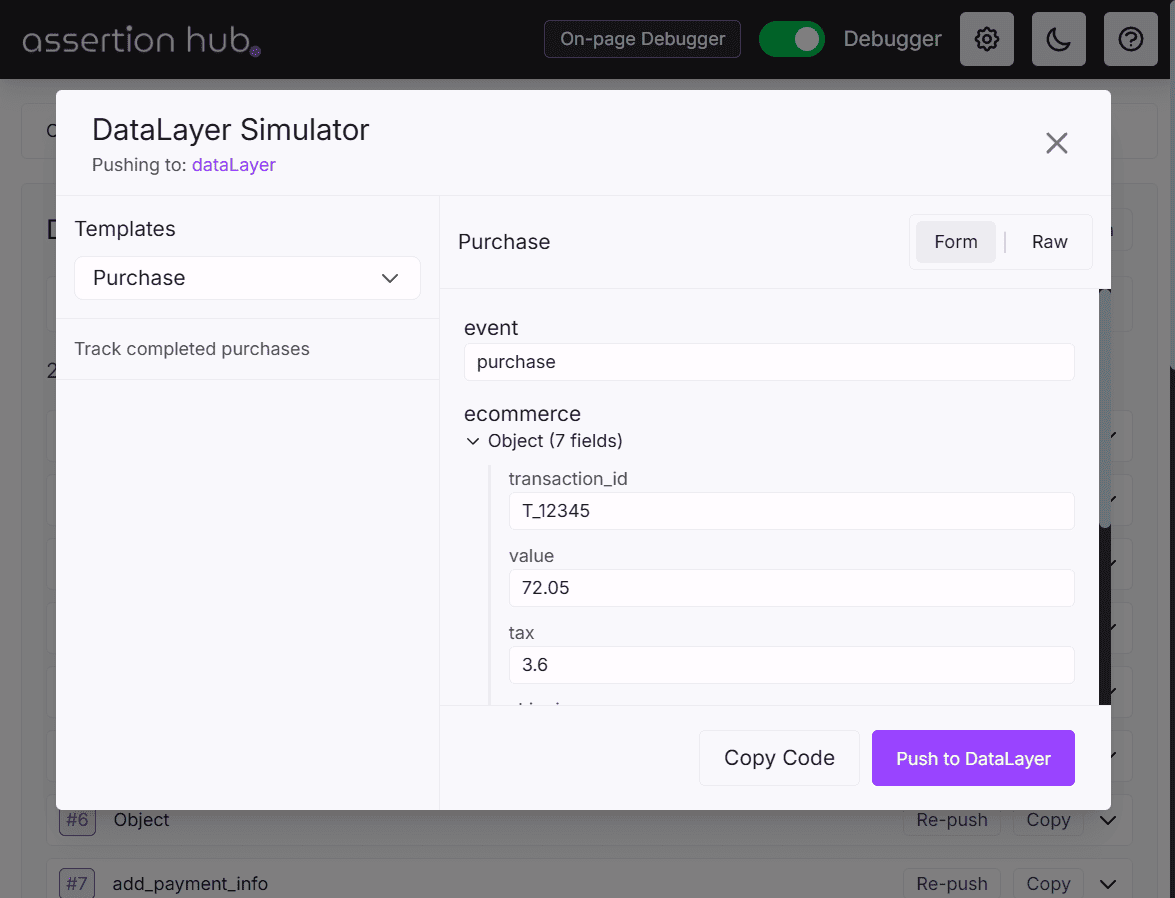
DataLayer Simulator
The DataLayer tab also includes a built-in simulator that lets you push synthetic events directly to the dataLayer from the extension popup, without touching your codebase. GTM processes the push exactly as it would a real one from your site, so you can test how your tags respond to a specific event structure before any code is deployed.
Read the full guide: DataLayer Viewer and Simulator →
Ready to explore more of AH Debugger? Read What is AH Debugger →