Debug Analytics and Marketing Events in Chrome: GA4, Facebook, Adobe and More
- AH Debugger intercepts GA4, Facebook Pixel, Adobe Analytics, Bing UET, TikTok, and more without touching the network panel.
- The console overlay displays decoded event data in plain text. No URL-encoded query strings to parse manually.
- The DevTools panel stores the full request log for the session, including POST body contents broken into individual hits for batched requests.
- Errors detected in requests are flagged automatically with a red badge so you don't need to know what to look for.
What are Analytics Request Logs
If you have ever opened the Chrome network panel to track down a GA4 hit, decoded a URL-encoded query string by hand, or missed a Facebook Pixel event because it fired before you could filter the tab, you know how much friction the standard approach adds to every debugging session.
AH Debugger is a free Chrome extension that removes that friction. Install it from the Chrome Web Store, toggle it on for any tab, and every outbound analytics and marketing event is intercepted and made readable instantly, in three places: styled console logs, a floating Overlay, and a searchable DevTools panel. It works across GA4, Facebook Pixel, Google Ads, Adobe Web SDK, Bing UET, Pinterest Tag, TikTok, and more.
This article covers analytics network request logs. For dataLayer push logs, read GTM DataLayer Push Logs →
Console Logs
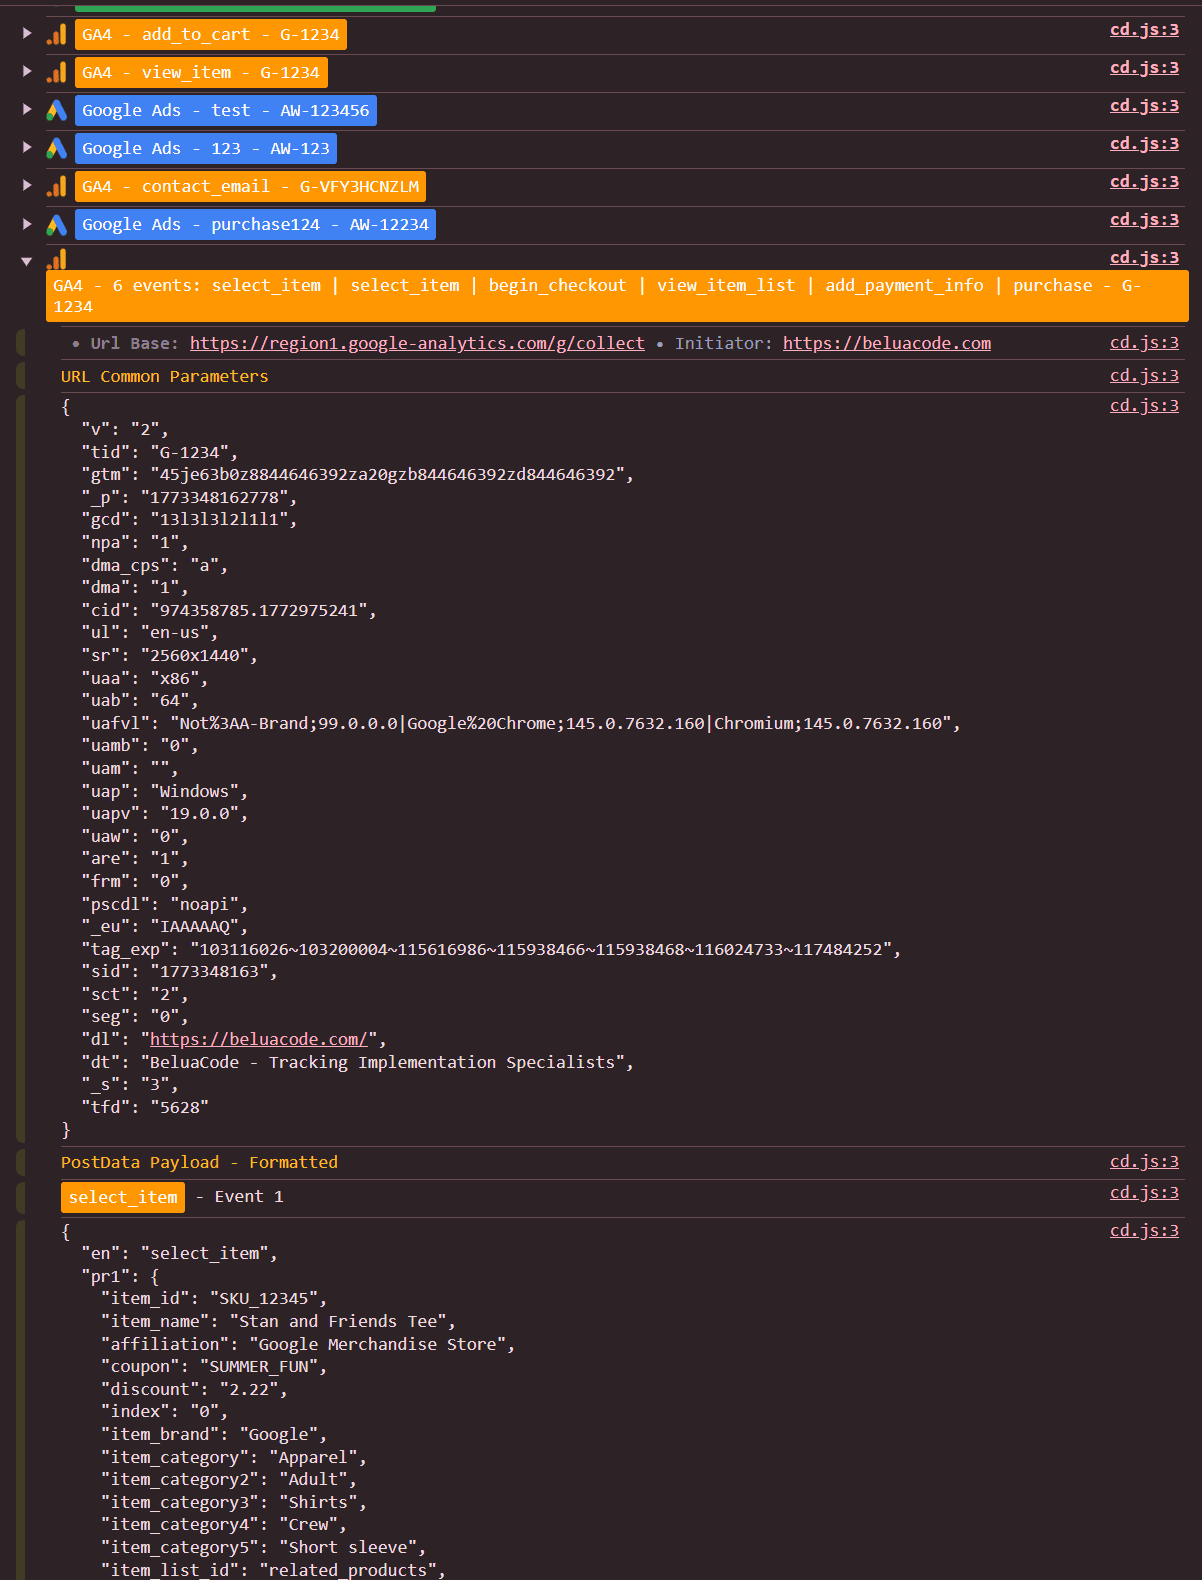
With AH Debugger active, every analytics request produces a styled log entry in your browser console (F12 → Console). Each entry shows:
- A vendor logo badge color-coded by platform, so you can visually distinguish a GA4 hit from a Facebook Pixel event or a Bing UET event at a glance
- The event name and account ID extracted from the request
- URL base and initiator: where the request is going and what triggered it
- URL Parameters: the formatted query string payload, readable without manual decoding
- PostData: the POST body if present. For GA4, which batches multiple events into a single POST request, the body is broken apart so you can inspect each hit individually
Console logs can be toggled independently in the extension settings, so you can disable them without affecting the Overlay or DevTools panel.
Console Overlay
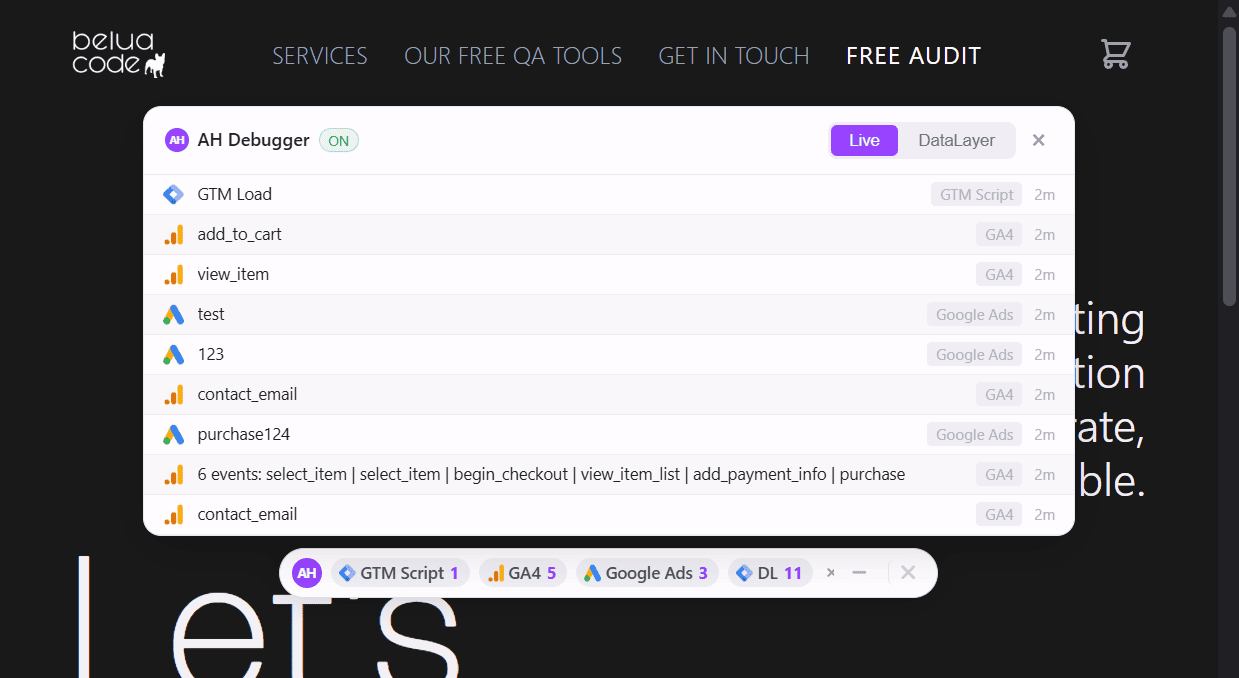
The Overlay is a floating panel that sits on top of the page, giving you a live requests feed without keeping DevTools open. Toggle it on from the extension popup.
- Every analytics hit appears instantly with a vendor icon, event name, and a time-ago timestamp
- The feed shows the last 50 events and auto-scrolls as new ones arrive
- Errors are highlighted in red so nothing slips past during a manual test walk-through
- Drag the overlay to any position on the page, minimize it to a compact pill, or hide it and reopen it from the popup without losing the session
The Overlay also has a separate DataLayer feed tab for monitoring dataLayer pushes. Read more in GTM DataLayer Push Logs →
DevTools Panel
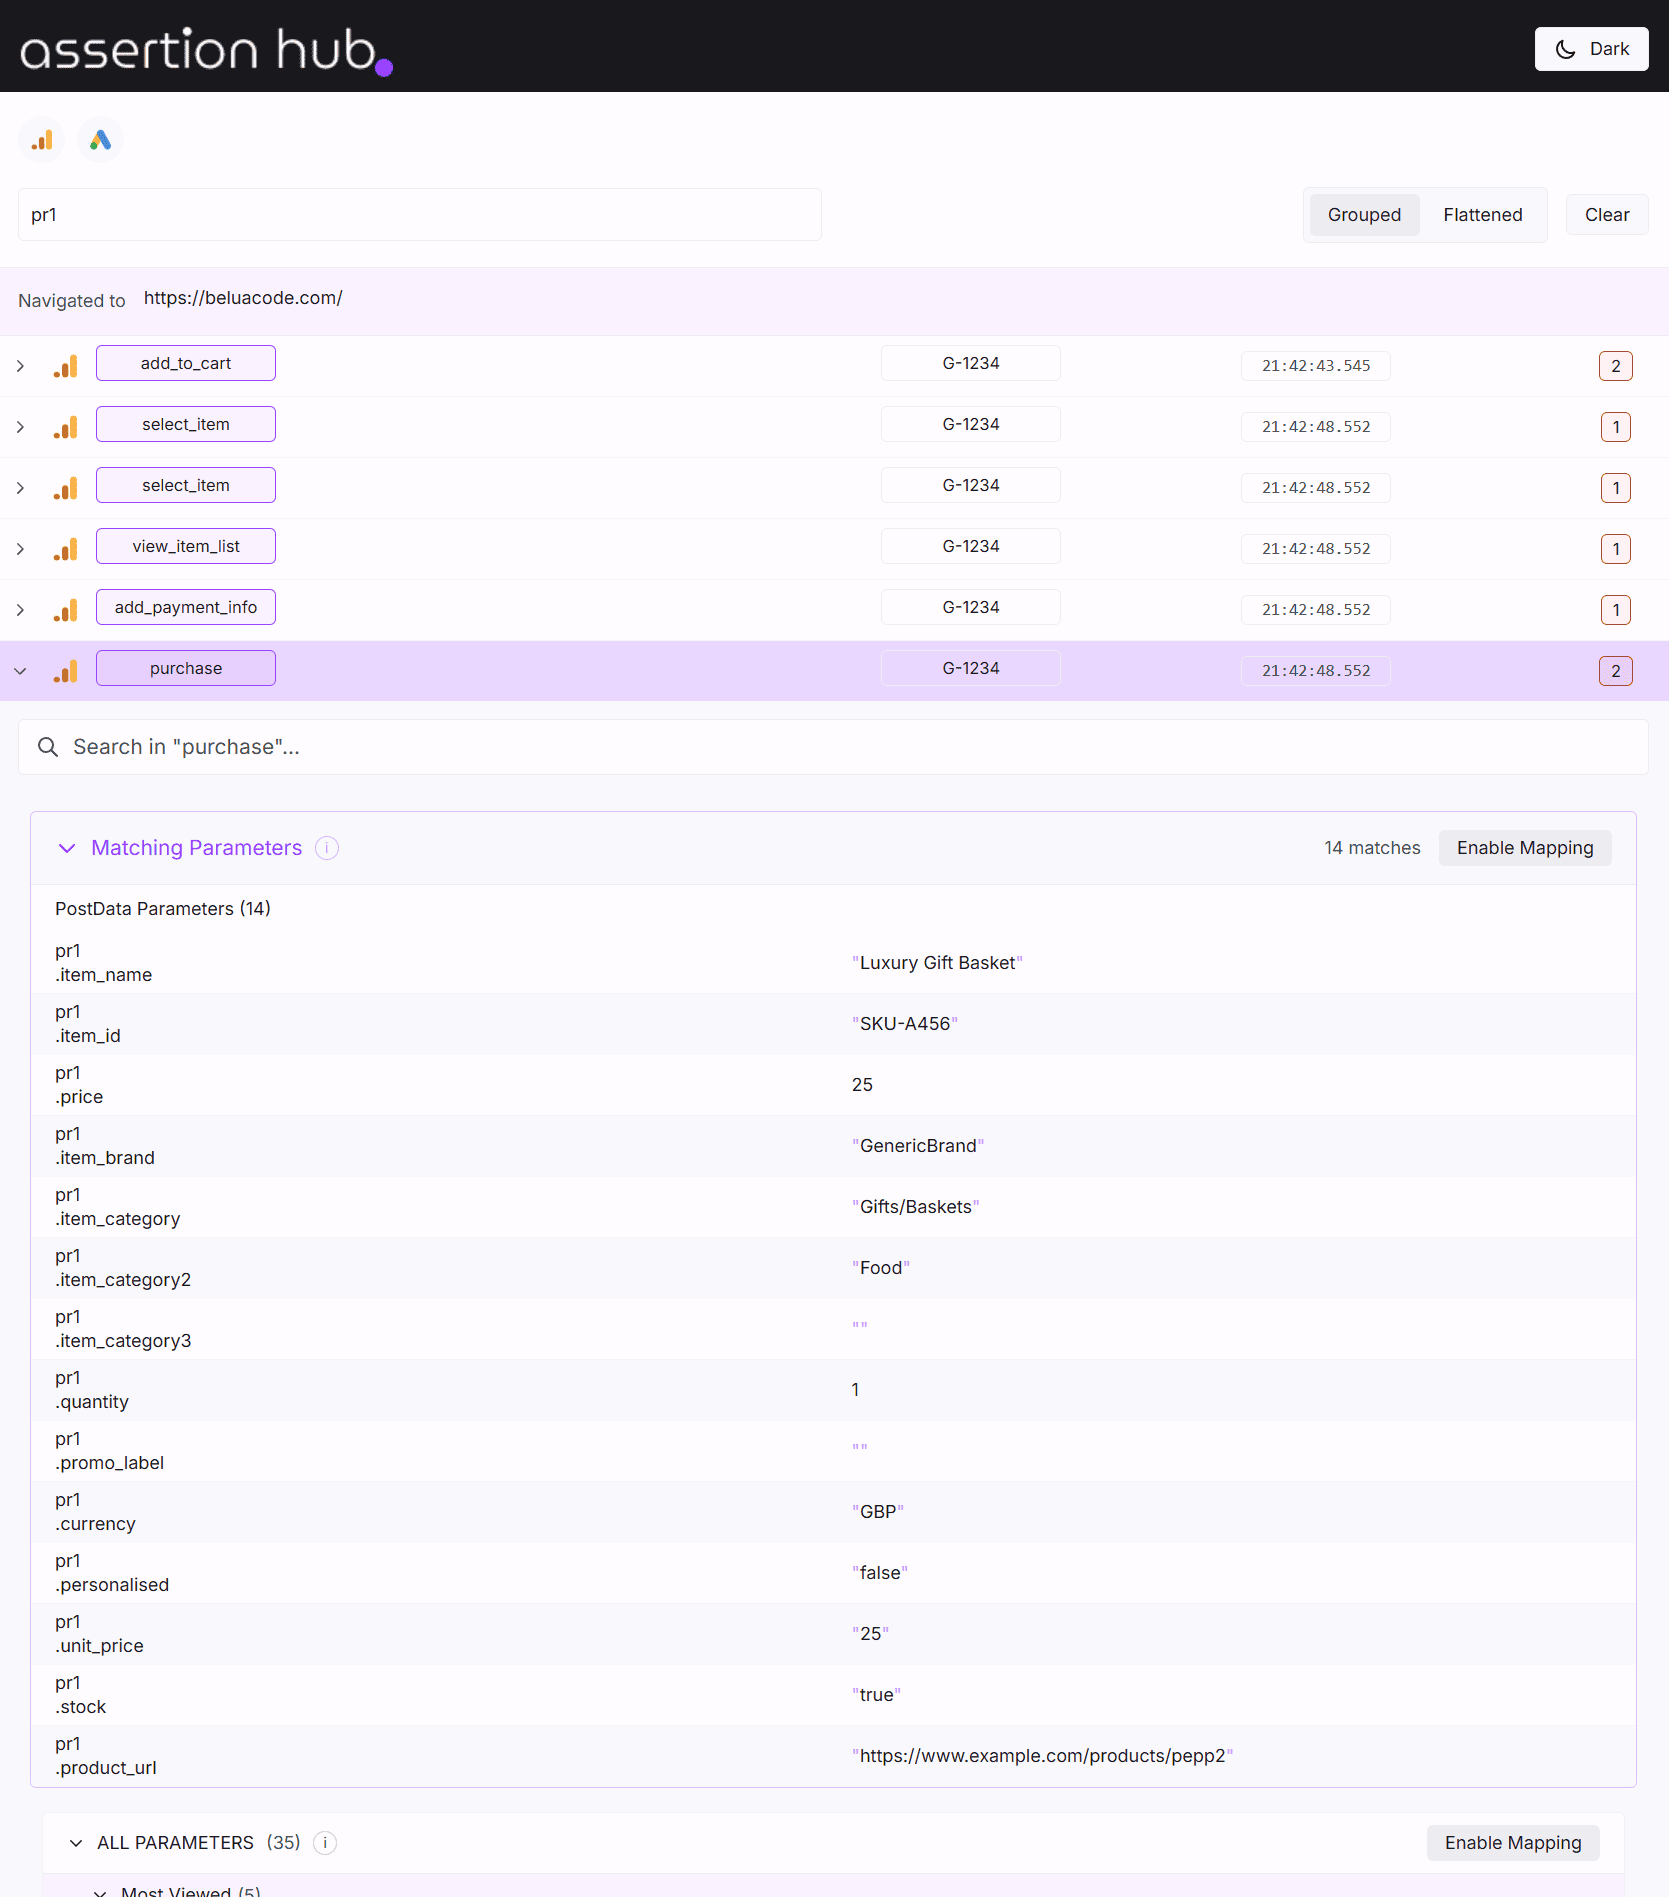
The DevTools panel is where you go when you need to investigate across an entire browsing session. Open it by right-clicking any page, selecting Inspect, clicking the double arrow icon in the top right of DevTools, and choosing AH Debugger from the dropdown.
- Full request table: every intercepted analytics request listed with vendor, event name, timestamp, status, and error indicators. Paginated at 100 requests per page
- Grouped and flattened views: toggle between requests grouped by event name and a flat chronological list
- Per-vendor filtering: show only GA4, only Facebook, only Adobe, or any combination
- Global search: filter every request across all vendors and all collected data by any parameter name or value. Search for
transaction_idto find every purchase hit. Search foritemsto find every request where the items array is present. No other analytics debugger extension on the market offers this - Full request inspection: expand any request to see its complete URL, all query parameters, POST body, response status, and error details. GA4 batch requests are broken apart so you can inspect each hit individually
Error detection
Requests that return HTTP 4xx or 5xx status codes are flagged with a red badge in both the console logs and the DevTools panel. The status code is shown directly on the badge so you can identify the error type without opening the network panel.
Common causes include an invalid Measurement ID in the tid parameter, a malformed POST body, or a rate limiting response from the platform endpoint. The full request details in the DevTools panel give you everything you need to diagnose the issue without switching tools.
Ready to explore more of AH Debugger? Read What is AH Debugger →